TamoGraph Site Survey

by Tamosoft

TamoGraph Site Survey

by Tamosoft

TamoGraph Site Survey
by Tamosoft

Spectrum Analysis in TamoGraph

Spectrum analysis involves the use of special RF equipment designed to listen to and analyze the frequency bands utilized by Wi-Fi devices.
Because these bands are unlicensed, they are often shared with non-Wi-Fi sources of RF signals, such as wireless video cameras, microwave ovens, or cordless phones, which cause interference. The purpose of spectrum analysis is to detect and identify such sources of interference, eliminate them, and identify the WLAN channels with minimal interference.
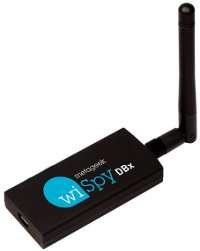
TamoGraph can perform spectrum analysis simultaneously with passive surveys by interfacing with Wi-Spy, a USB-based spectrum analyzer (you can order it from us, as a bundle with TamoGraph, or directly from 
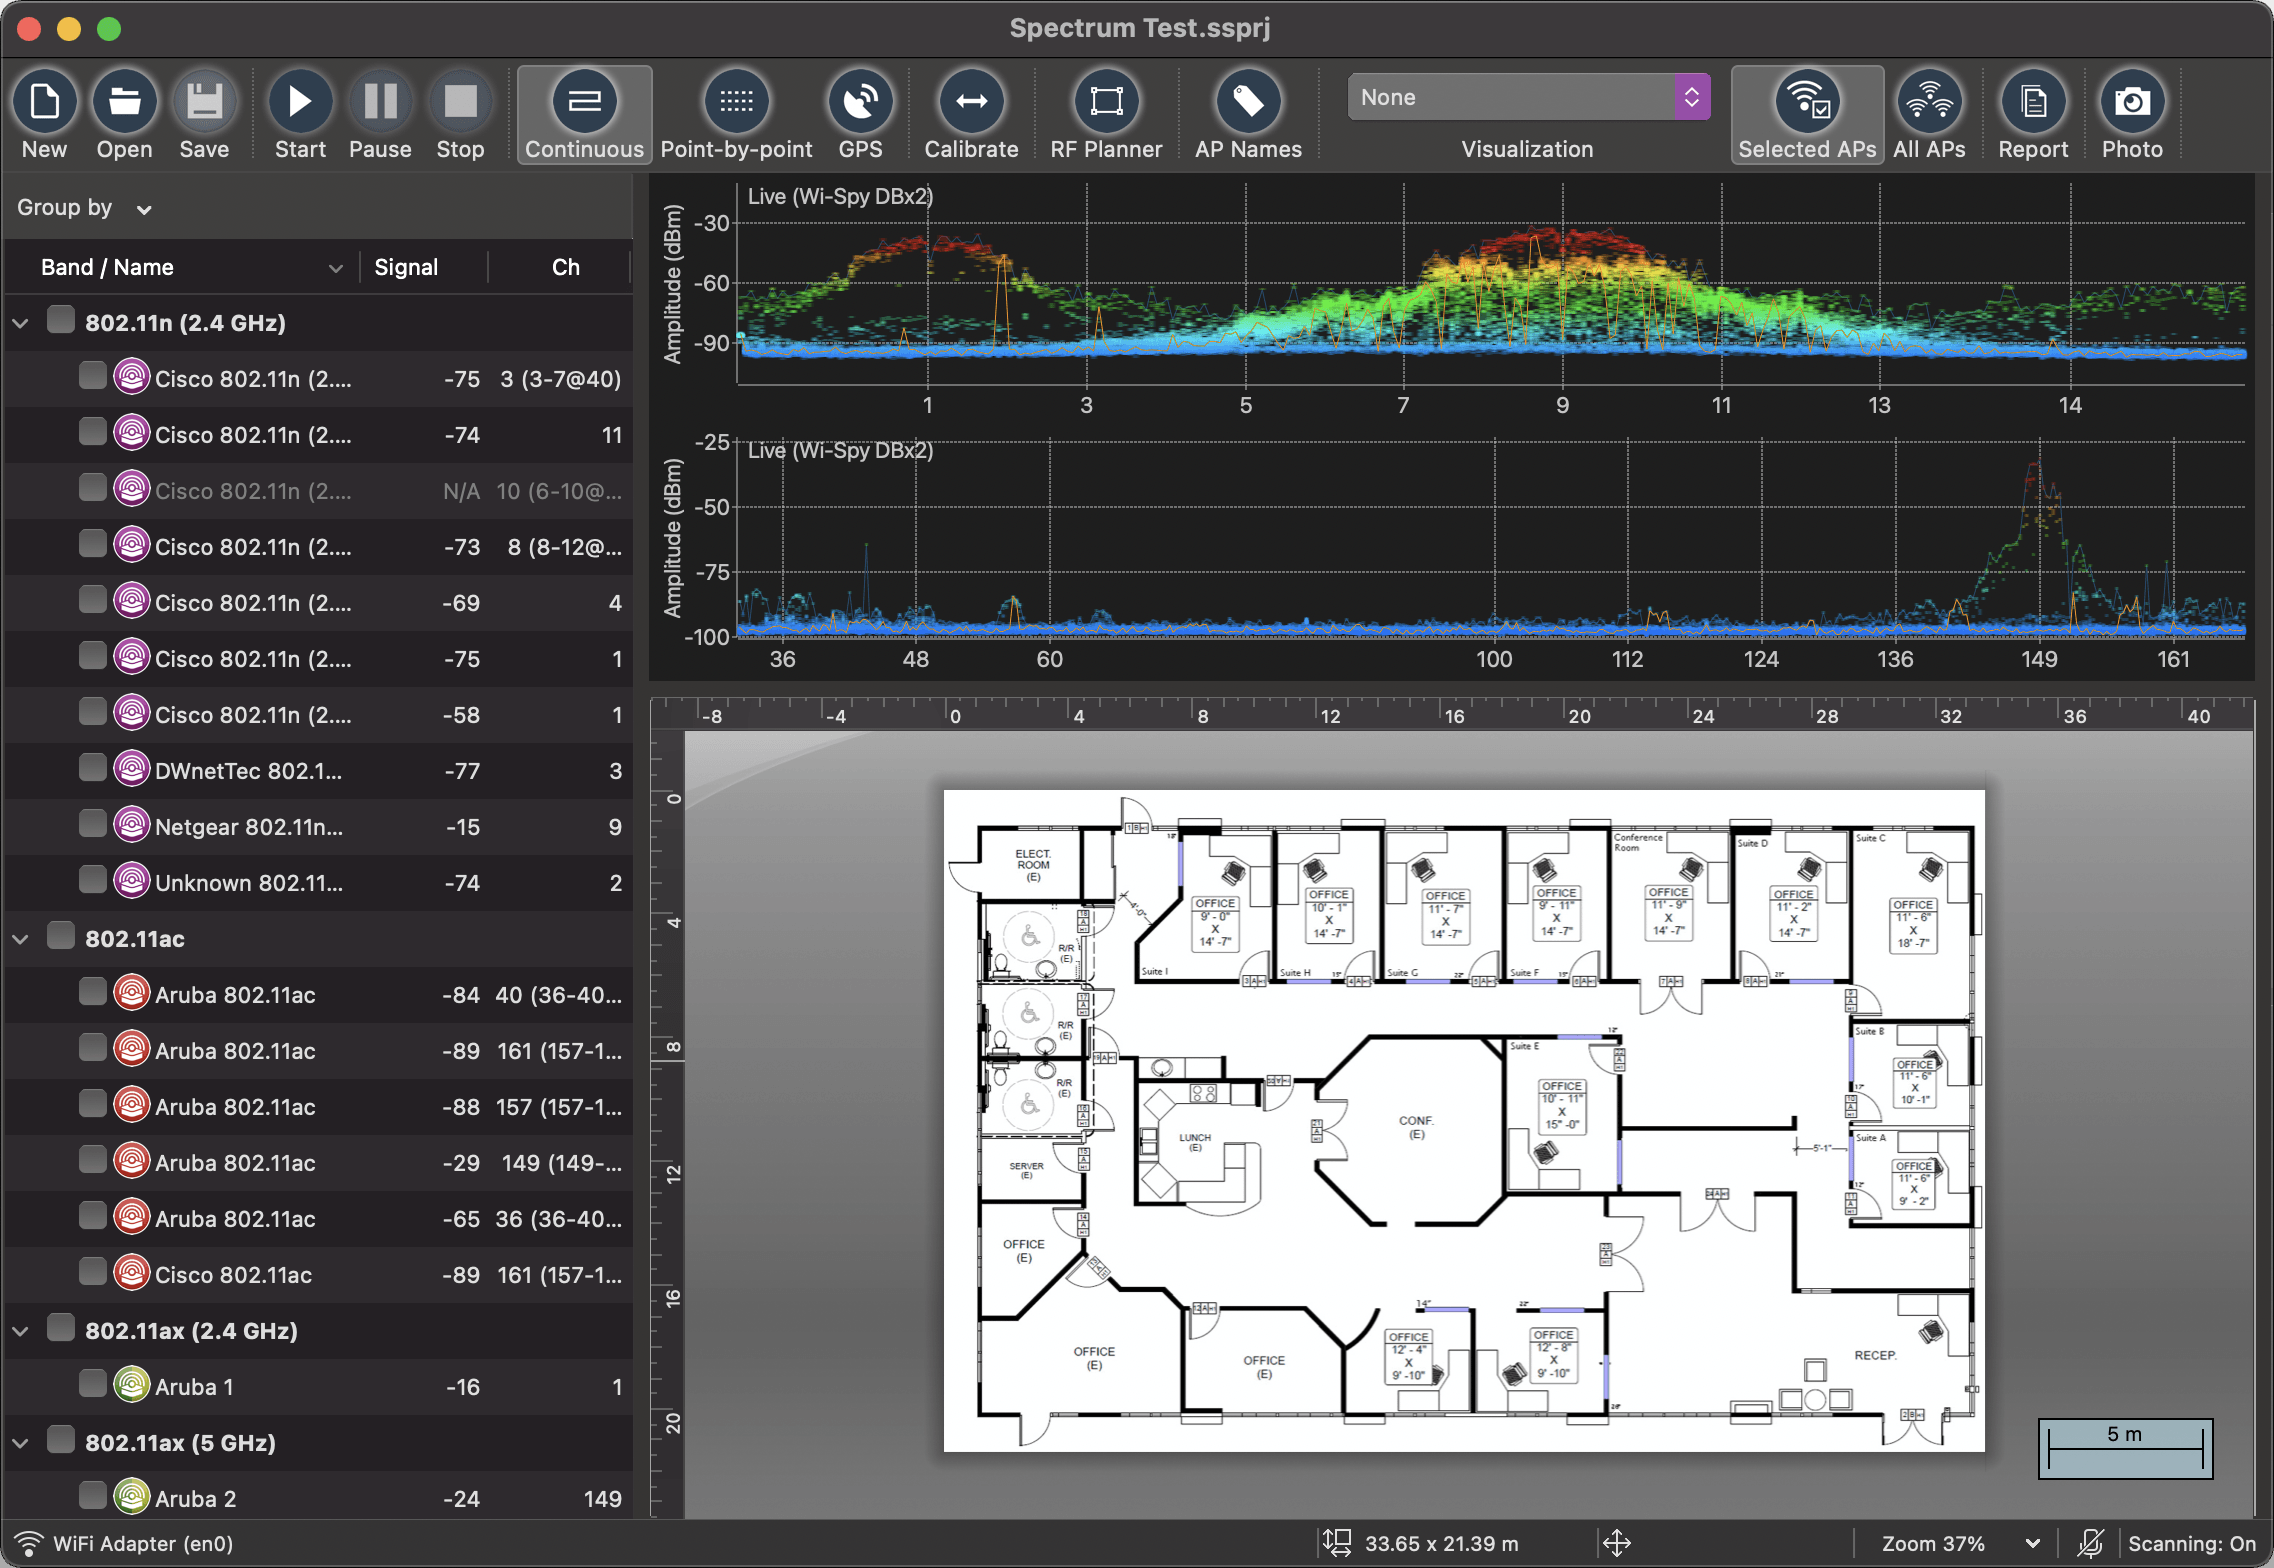
MetaGeek). When Wi-Spy is plugged in, a live spectrum picture is displayed on the central pane of the main TamoGraph window, as shown below.

The survey procedure is very similar to the one that you follow when you perform standard passive surveys. After you have performed a survey, the spectrum data collected can be viewed in two ways. The first option is viewing data in the main application window. When you hover the mouse over any point of the walkabout path, the spectrum pane displays the graph for the given survey point. The second option is viewing data in PDF or HTML reports. When a report with spectrum data is generated, location markers are overlaid on the floor plan and walkabout path, and a sequence of spectrum charts corresponding to each location marker is added to the report.

Download TamoGraph Site Survey
Download TamoGraph Site Survey now to see for yourself how this tool can help you reduce the time and costs that are involve in deploying and maintaining Wi-Fi networks and improve network performance and coverage. Spectrum analysis is an optional feature; if you plan to perform spectrum analysis surveys, be sure to also get Wi-Spy.

© 1998 – 2024 Tamosoft Ltd.